
Opinion: New Piedmont Pool Energy Usage
A Look at the California Electrical Grid Evolution –
I got interested in studying the California electric grid as the result of the passage of Measure UU. The amount of energy consumed by an aquatic facility is significant: in 2019 the existing pools used 25,396 therms of gas and 110 MWh of electricity a year, equivalent to 854 MWh (1MWh = 1,000 kwh). The new Piedmont aquatic facility is planned to have three times the surface and therefore could need as much as three times more energy in a steady state.
Clearly the new facility ought to minimize greenhouse gases (GHG) emissions. Given the expected lifetime of the future facility, it makes sense to look forward and consider its GHG footprint in the long term in the context of the evolution of the grid, the City Climate Action Plan and the State 2050 decarbonisation goals.
I built a simulation engine for the California grid based on the hourly empirical data available for the year 2019 from the Energy Information Agency (EIA) and the California Public Utility Commission. It simulates the way the energy available from various in-state and out-of-state sources are fed into the grid to meet demand. Increase in wind and solar supply is assumed to be based on scaling existing farms, therefore resulting in a proportional increase in such hourly energy offered to the grid. Demand is scaled based on the projection of the adoption of electric vehicles, the construction of new all-electric homes, and the conversion to electricity of residential, commercial, and industrial natural gas usage. Each sector has its own specific hourly demand distribution.
Wind and solar are energy sources with very large down and up swings.
-
On the down side in 2019 the wind and solar offering fell below 5% of hourly demand 19% of the time. Such intermittent power needs to be backfilled on a real time basis by dispatchable sources to match demand. Dispatchable energies are generated by power units able to vary output to follow demand, such as natural gas, hydroelectric, nuclear and geothermal plants. The utilisation factor of such traditional plants diminishes with intermittent energy use, but the plants cannot be decommissioned because their full power is needed for the several hours a year with high demand and lack of wind and sun.
-
On the up side, wind and solar energy production has to be curtailed whenever its hourly generation exceeds demand (minus a dispatchable energy floor to ensure reliable service). As the proportion of wind and solar power offered to the grid relative to demand increases, the proportion of such refused energy relative to the one offered increases.
The graph below is the result of running scenarios on the simulator corresponding to the projected demand in 2045. Note that the projection does not take into account converting industrial natural gas use (768,188 million cubic feet a year) to electricity, equivalent to 225 TWh a year assuming all industrial usage is for heating (one TWh equals 1,000,000 MWh).
The refused wind and solar energy could be converted to hydrogen through electrolysis rather than curtailed and used either to power hydrogen cars, to generate dispatchable electricity through hydrogen turbines and/or to be mixed with natural gas for distribution through the existing gas network. See below: 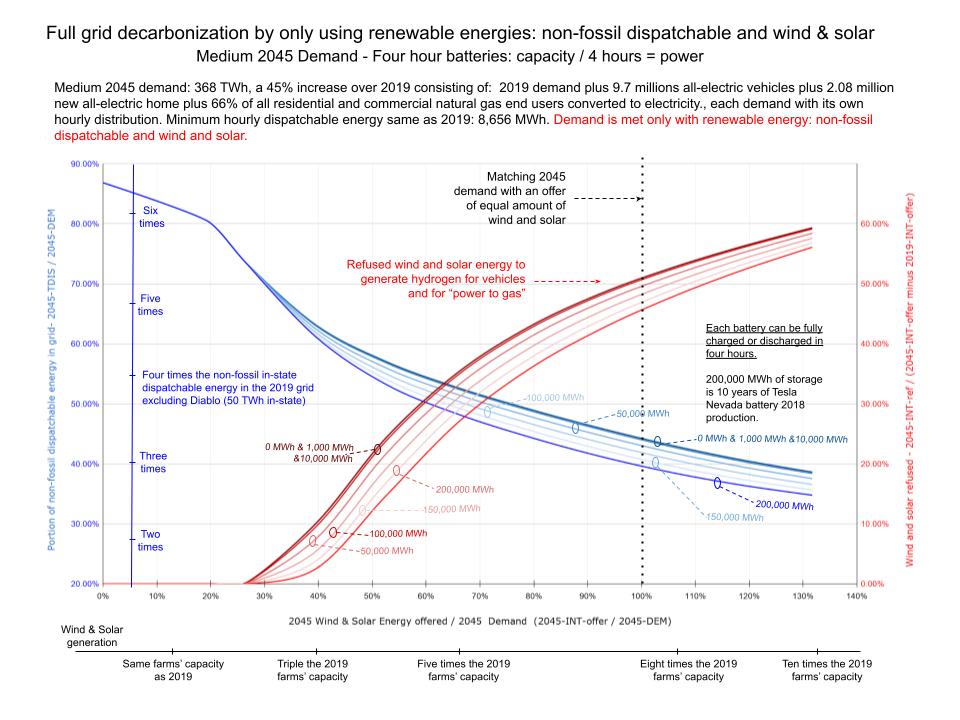 Looking at the various possible evolutions of the mix of energy sources in the grid, I was hoping to calculate the sweet spot on the blue lines in the chart for the ratio of wind and solar power offered relative to demand that would optimize all life cycle costs and service reliability. But I failed because of the large uncertainties on many parameters which would allow me to reach any conclusion that I am biased towards, in particular:
-
Cost of upgrading the natural gas distribution network to handle hydrogen.
-
Life cycle cost of new nuclear and hydrogen dispatchable power plants.
-
Life cycle cost of new solar and wind farms with potentially lower level of utilization than currently accounted for.
-
Life cycle cost of traditional power plants operated at much lower utilisation factor, but still needed to power the grid in the hours with no wind and solar.
-
Energy efficiency in the electricity-hydrogen- electricity life cycle.
-
Life cycle cost of batteries.
Politics will drive where the grid ends up. Currently intermittent energy sources are favored over dispatchable non-fossil power plants as they create jobs all over California rather than in a few places and have a projected low life cycle cost.
With regard to the design of the new aquatic facilities, I would favor a single smaller pool focused on sports rather than recreation because of my belief that frugality is essential to meet the climate challenge. In any case, I know that a competent team focused on sustainability is working on the design of a “green” pool and I am confident that the promises of Measure UU will be achieved to the satisfaction of our community.
Bernard Pech, Piedmont Resident

For clarification:
Left axis:
2045-TDIS: total dispatchable energy in the grid (both in-state and out-of-state). For the grid to be fully decarbonized, such dispatchable energy must be non-fossil, such as hydroelectric, atomic, geothermal, …
2045-DEM: total demand for electricity in 2045. It is equal to the total generation.
Right axis:
2045-INT-offer: the total amount of wind and solar energy offered to the grid in 2045.
2019-INT-offer: the total amount of wind and solar energy offered to the grid in 2019. In 2019, the total amount of such energy that did not make it into the grid is very small, and therefor all the energy offered made it into the grid.
2045-INT-ref: the total amount of offered wind and solar energy offered to the grid that does not make it into the grid.
For correction:
The minimum value for the wind & solar energy offered in 2045 is the 2019 wind and solar in the grid. It corresponds to 13% of 2045 demand. Hence the blu curve should not show any value corresponding to less than 13%.
Wow Bernard. Very impressive. Hope you sent this to the CEC as well
as PCA.
If you don’t mind dumbing it down for this non-physicist, are you saying that having the grid refuse wind/solar is a good thing because that energy can be used to generate hydrogen for energy which can be used in the evening? Alternatively, Can the wind/solar be stored in batteries for nighttime use?
Do you think there might be a “sweet spot” for pool size where a mix of heat pumps/solar panels/pool covers could supply sufficient energy to heat the pool during daylight hours? This might require tweaking pool operation to daylight hours only so there is sufficient solar to heat the pool. Current hours are 5:30 am to 9:00 pm. As the swim teams can now swim from 3:00 to 6:00 pm with the new design, perhaps the pool could close at 6:00 pm or when the sun hours down.
Hydrogen is one way to store excess wind and solar energy. A store made out of batteries is another way. But any type of storage requires capital investments and operational costs (and also has a carbon footprint). Toyota for sure believes in hydrogen cars and most likely is not counting on the very GHG-emitting steam-methane reforming process for hydrogen production.
I have my doubts about the economics of a large grid store to smooth out the ups and down of wind and solar. One way to look at such a store is as a dispatchable power plant that produces an amount of energy equal to what the store releases to the grid. Its rated power is the power at which the store can load or release energy divided by two. I calculated the utilization factor of such a “plant” using the same 2045 demand load and the simulator. Depending on the store rated power, the utilization factor is between 20 and 33%. Refer to the graph “Grid Store Utilization Factor” on my shared google drive folder: https://drive.google.com/drive/folders/1zX9r05nFEyUo6D7f7C6A0adJXF1PYxDl?usp=sharing
A better strategy might be to invest in non-fossil dispatchable power plants with the added benefit of enhancing the grid service reliability. In order to backfill solar and wind, dispatchable plants are needed at a power level close to the total power demand of the grid (modulo a policy of rolling blackouts). With lots of wind and solar farms, these plants will have a low utilization factor to support their fixed costs. Where the life cycle cost sweet spot is in the mix of wind and solar and dispatchable plants?
A pool’s water is a reservoir of heat with much inertia. Swimmers can tolerate some variation in the pool temperature. A demand response approach could be effective in reducing operating costs (and global GHG emissions) by soaking up wind and solar overproduction in real time. The potential savings are likely to be worth the cost of a well instrumented pool with a smart controller.
I have added a graph in the google drive folder associated with the posting.
https://drive.google.com/drive/folders/1zX9r05nFEyUo6D7f7C6A0adJXF1PYxDl?usp=sharing
It rates new wind and solar offers made by Community Choice Aggregators such as EBCE (the East Bay Community Energy, a utility used by many Piedmont residents) with regard to renewability.
If the ratio of the wind and solar energy offer to the demand is low in the grid at the time a new offer is made by an ACA (meaning the demand is met mainly by dispatch-able sources), the ACA may claim that a pure wind and solar new incremental offering is 100 % renewable. But if the ratio is high, a significant portion of the new offering will be refused. The new offer must be enhanced either with extra grid storage or extra non-fossil dispatch-able energy.
Under the scenario of the 2045 “medium demand” introduced before, the rating of a pure wind and solar new offer, defined as the ratio of the part of the offer that makes it into the grid, is between 75% and 25% depending on whether the offer is made associated with an equal amount of new demand or not.
The ACA could also choose to sell its refused energy for the production of hydrogen (meaning new demand would be created dynamically to match the about-to-be refused energy to soak up this electricity and convert it to hydrogen). However, due to the low efficiency of the cycle electricity – hydrogen – electricity (around 30%?), the ACA would still have to enhance its offering (by about 30% less).
Needless to say, I am talking about the future evolution of the grid. Today and for the foreseeable future, EBCE’s claim of offering 100% renewable electricity is totally legitimate because the ratio of wind and solar energy in the grid is still relatively low. EBCE is experimenting with grid storage as it plans to put on line 282 MWh of it in 2022.