Apr 28 2021
|
|

|

|
|
|
Birth rates have steadily fallen in California since the aftermath of World War II, when the baby boom first sent the state’s population soaring. According to state data, births have declined by more than 15 percent in the past decade.
But California’s baby bust since the last census has also been more acute than in the rest of the country. Take the fertility rate, which demographers typically define as births per 1,000 women between the ages of 15 and 44.
Nationally, that rate fell from 64.1 in 2010 to 58.3 in 2019 — a loss of 5.8 births per 1,000 women of childbearing age. In California, however, the decline was 11.7 births. By comparison, the fertility rate in Florida dropped by fewer than four births.
Older adults have outpaced growth in children or working-age adults to become the state’s fastest-growing age group. The state projects that by 2030, more than nine million Californians will be over 65. New York Times
Read April 26, 2021 NYT article here
The City of Piedmont is collaborating with East Bay Community Energy (EBCE), Piedmont’s local power provider to offer an induction cooktop lending program for Piedmont residents. The program started in April 2021.
Here’s how it works:
The meeting agenda and ways to participate are > here.
For questions about the PBAC, contact Gopika Nair (City staff liaison), at SaferStreets@Piedmont.ca.gov o
This Thursday, April 22, the City will be holding virtual events featuring a presentation and community discussion about Piedmont’s Climate Action Plan and a discussion of the documentary Rebuilding Paradise with a panel of local fire experts, including the City’s new Fire Chief.
The City will also announce the winners of this year’s Piedmont Climate Challenge. Visit the City’s Earth Day page to find additional information about the events including a list of regional celebrations and resources.
PROVIDE INPUT TO THE CITY COUNCIL AT:
READ THE FULL AGENDA AND METHODS OF WATCHING AND PARTICIPATING BY CLICKING BELOW.
I got interested in studying the California electric grid as the result of the passage of Measure UU. The amount of energy consumed by an aquatic facility is significant: in 2019 the existing pools used 25,396 therms of gas and 110 MWh of electricity a year, equivalent to 854 MWh (1MWh = 1,000 kwh). The new Piedmont aquatic facility is planned to have three times the surface and therefore could need as much as three times more energy in a steady state.
Clearly the new facility ought to minimize greenhouse gases (GHG) emissions. Given the expected lifetime of the future facility, it makes sense to look forward and consider its GHG footprint in the long term in the context of the evolution of the grid, the City Climate Action Plan and the State 2050 decarbonisation goals.
I built a simulation engine for the California grid based on the hourly empirical data available for the year 2019 from the Energy Information Agency (EIA) and the California Public Utility Commission. It simulates the way the energy available from various in-state and out-of-state sources are fed into the grid to meet demand. Increase in wind and solar supply is assumed to be based on scaling existing farms, therefore resulting in a proportional increase in such hourly energy offered to the grid. Demand is scaled based on the projection of the adoption of electric vehicles, the construction of new all-electric homes, and the conversion to electricity of residential, commercial, and industrial natural gas usage. Each sector has its own specific hourly demand distribution.
Wind and solar are energy sources with very large down and up swings.
On the down side in 2019 the wind and solar offering fell below 5% of hourly demand 19% of the time. Such intermittent power needs to be backfilled on a real time basis by dispatchable sources to match demand. Dispatchable energies are generated by power units able to vary output to follow demand, such as natural gas, hydroelectric, nuclear and geothermal plants. The utilisation factor of such traditional plants diminishes with intermittent energy use, but the plants cannot be decommissioned because their full power is needed for the several hours a year with high demand and lack of wind and sun.
On the up side, wind and solar energy production has to be curtailed whenever its hourly generation exceeds demand (minus a dispatchable energy floor to ensure reliable service). As the proportion of wind and solar power offered to the grid relative to demand increases, the proportion of such refused energy relative to the one offered increases.
The graph below is the result of running scenarios on the simulator corresponding to the projected demand in 2045. Note that the projection does not take into account converting industrial natural gas use (768,188 million cubic feet a year) to electricity, equivalent to 225 TWh a year assuming all industrial usage is for heating (one TWh equals 1,000,000 MWh).
The refused wind and solar energy could be converted to hydrogen through electrolysis rather than curtailed and used either to power hydrogen cars, to generate dispatchable electricity through hydrogen turbines and/or to be mixed with natural gas for distribution through the existing gas network. See below: 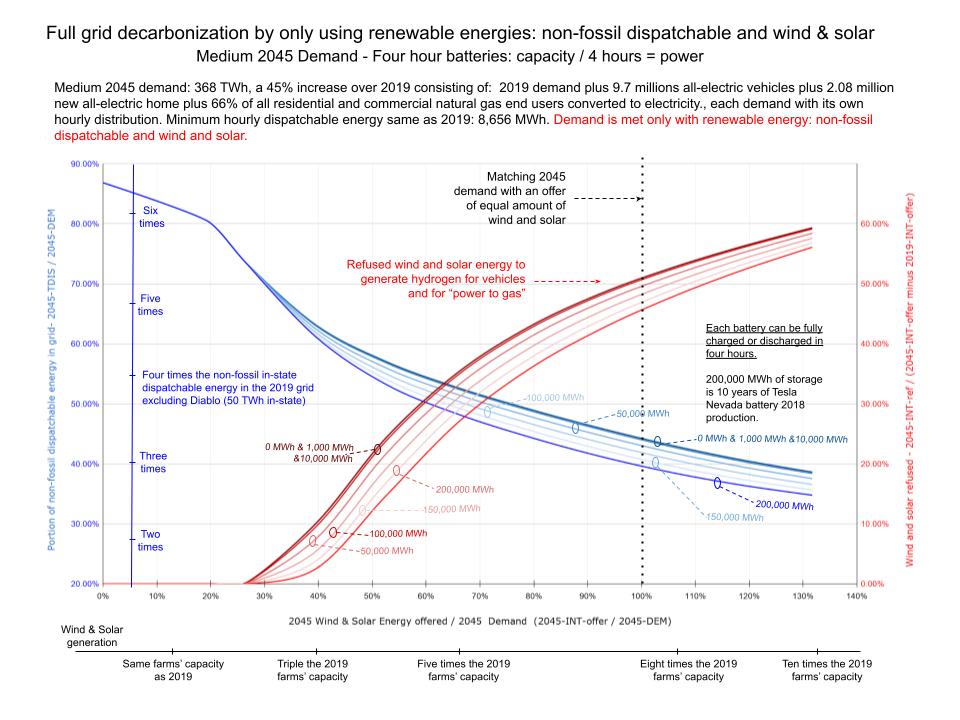 Looking at the various possible evolutions of the mix of energy sources in the grid, I was hoping to calculate the sweet spot on the blue lines in the chart for the ratio of wind and solar power offered relative to demand that would optimize all life cycle costs and service reliability. But I failed because of the large uncertainties on many parameters which would allow me to reach any conclusion that I am biased towards, in particular:
Cost of upgrading the natural gas distribution network to handle hydrogen.
Life cycle cost of new nuclear and hydrogen dispatchable power plants.
Life cycle cost of new solar and wind farms with potentially lower level of utilization than currently accounted for.
Life cycle cost of traditional power plants operated at much lower utilisation factor, but still needed to power the grid in the hours with no wind and solar.
Energy efficiency in the electricity-hydrogen- electricity life cycle.
Life cycle cost of batteries.
Politics will drive where the grid ends up. Currently intermittent energy sources are favored over dispatchable non-fossil power plants as they create jobs all over California rather than in a few places and have a projected low life cycle cost.
With regard to the design of the new aquatic facilities, I would favor a single smaller pool focused on sports rather than recreation because of my belief that frugality is essential to meet the climate challenge. In any case, I know that a competent team focused on sustainability is working on the design of a “green” pool and I am confident that the promises of Measure UU will be achieved to the satisfaction of our community.
Bernard Pech, Piedmont Resident
The application proposes to construct new signage at the gas station including: a new interior–lit monument sign with digital price indicators at the corner of Highland Avenue and Highland Way; a digital LED–lit sign on the gas station canopy; and unlit signage above the convenience store and auto repair garage.
Virtual Meeting by ZOOM Teleconference open to the public. See agenda for instructions on tuning in. > Agenda
With the state-mandated relaxation of the rules for accessory dwelling units (ADUs) and junior accessory dwelling units (JADUs), the City of Piedmont is producing new housing at a rate not seen since the 1960s.
Since 2015, the City has issued building permits for approximately 73 new homes. In 2019, the Building Division issued 11 building permits for new homes. In 2020, the Building Division issued 24 building permits for new homes and expects to issue an increasing number of building permits in 2021. The vast majority of building permits are for the construction of small detached cottages or the conversion of space inside existing homes to be used as apartments. These small apartments are called ADUs [Accessory Dwelling Units] and JADUs [Junior Accessory Dwelling Units].
The City has finaled the construction of approximately 60 new homes since 2015. However, the City has produced only 12 of the 24 very-low-income affordable housing units required by state law.
The annual progress report can be an assessment tool for the effectiveness of the City’s fair housing policies and programs. In addition, the annual progress report informs the development of the City’s next Housing Element update, scheduled to begin later this month. The first meeting of the Piedmont Housing Advisory Committee is scheduled for April 20, 2021.
Currently, the state-mandated housing goal for Piedmont’s next Housing Element for the 2023 to 2031 time period is 587 housing units. City staff have questioned the accuracy of the state’s methodology for determining the new 587-unit goal. More information about the next Piedmont Housing Element update is at www.PiedmontIsHome.org < RESIDENTS CAN SHARE OPINIONS.
Report to be presented to the Piedmont Planning Commission on > Monday, 5:30 pm > April 12, 2021…….
The City of Piedmont finaled building permits for six new accessory dwelling units (ADUs) in 2020, bringing the total of housing units constructed to 55 new units out of a state-mandated allocation of 60 new units by the end of 2022. In addition, the City of Piedmont issued new building permits for 21 new ADUs and three new single-family houses, bringing the total number of building permits, issued since 2015, up to 73 permits.
The 2020 annual progress report shows that the City of Piedmont is close to meeting and surpassing the annual rate of construction of new housing units anticipated by the RHNA, having issued building permits for the construction of approximately 73 new units out of a state mandated allocation of 60 new units by the end of 2022. However, with the changes to state legislation, it will be challenging for the City of Piedmont to show that sufficient low and very low income housing is being produced under the 2015-2023 Housing Element’s programs and policies. The preparation of the next Housing Element will require innovative approaches to developing new housing with much higher goals. The next Housing Element will likely require the City to affirmatively plan for the development of approximately 587 new housing units on new sites not considered in the 2015-2023 Housing Element.
Consideration of innovative approaches to creating more and different types of housing is already underway. On April 20, 2021, the Piedmont Housing Advisory Committee (HAC) will hold its first meeting to consider housing and equity issues in Piedmont, including the draft RHNA and planning for the next Housing Element. Also, City staff members are in the process of leading community planning efforts, funded through the SB2 Planning Grant Program.
Through SB2, the City launched the Piedmont Is Home campaign on March 12, 2021 with the launch of a project website (piedmontishome.org) with interactive public engagement tools, such as the online Fair Housing survey and pinnable map, as well as a social media publicity campaign. These tools will be available to members of the Piedmont community, including people working in Piedmont, until April 15, 2021.
In addition, the ad hoc Subcommittee of the Planning Commission on Measure A-1 has been meeting with housing experts, including experts who are also Piedmont residents. The County of Alameda Measure A-1 program has made approximately $2.2 million available for the construction of affordable housing in Piedmont. The Alameda County Measure A-1 program recently granted Piedmont’s request to extend the deadline for the City’s application to use the $2.2 million in funding to a new deadline of December 31, 2022.
Through community engagement such as these early activities, the Piedmont Community will share ideas and problem-solve. Although there are many challenges ahead, Piedmont elected officials, staff and Community members are hard-working, intelligent, and creative. Piedmont will continue to be a leader in the Bay Area for innovation and housing equity and will find new ways to meet the state-mandated goals.
By: Pierce Macdonald-Powell, Senior Planner
Please find attached the City of Piedmont staff report for the Piedmont General Plan’s Housing Element annual progress report for 2020. This item is scheduled for a hearing before the Planning Commission on April 12, 2021. >AGENDA <
READ the full report with addresses and charts of new housing units below:
Readers are advised to watch the interviews and meeting now. A public meeting notice was not provided to media sites, including this one, an error noted by the City. Interested individuals could not know the March 22, 2021 meeting was taking place unless they checked the Police Department Bulletin Board * 24 hours prior to the meeting.
*Correction from the City Clerk: The agenda was posted in three locations, the city’s web site, City Hall (we’re posting on the front door, as the bulletin boards are not accessible to the public because of COVID), and the Police Department. Residents who went to any of these locations would have seen the agenda, not just individuals going to the Police Department. City Clerk John Tulloch 3/29/2021
PCA Editors Comment: PCA’s goal is for transparency, public information and public involvement. The California Brown Act, requires agendas to be timely distributed to requesting media outlets. PCA, a media outlet, received no notice. The City Clerk has apologized for the noticing error. 3/30/021
More to follow in the future on the process.

Content on the PCA website by Piedmont Civic Association is licensed under a
Creative Commons Attribution-NonCommercial-ShareAlike 3.0 United States License.
Some icons are Copyright © Yusuke Kamiyamane